- User Roles in GoTestPro WebApp
- Application Details and Test Credentials
- Jira - XRay - GTP Integration Details
- GoTestPro - Walkthrough Session
- How to Register Sign Up as a User Test Manager by Default
- Org Admin/Test Manager
- Test Engineer User Creation
- Forgot Password
- How to Change Password
- How to Create a Project
- How to Assign Projects to Users /Add Users to Project
- How to add TEAF Recorder Extension in Chrome Browser (QA/Dev Environment)
- How to add a Published Extension from Chrome Web Store
- How to Create Test using TEAF Recorder Extension
- How to Execute Test at Client Level Run All Mode
- How to Execute Tests at Client Level Debug Mode
- How to Create Data-Driven Scenario
- Scenario Duplication
- Record after Execution of Scenario / Execute and Continue Recording
- Common Scenario
- Delete while Recording
- How to add Test Configuration
- Execute Scripts on the Server side - LambdaTest
- How to add Page Elements (Locators)
- How to Create Scenario (Manually)
- How to Create a Scheduled Test
- Results Page
- Reports Emailing Enablement
- CI/CD ( Test trigger API)
- Auto Healing Feature
- How to add Assertions & Events while Recording
- How to add Variables:
- How to Export Test Execution Results to Xray - Jira
- API Testing
- How to do Visual Validation:
User Roles in GoTestPro WebApp
- RC Super Admin
- Org Admin/Test Manager
- Test Engineer
What Each User Role Can Do
Super Admin:
- Create/Edit/Delete Organization Account
- Activate/Deactivate Organization Account
- Create/Edit/Delete all user types, including Super Admin and Org Admin/Test Manager
Org Admin/Test Manager:
- Create/Edit/Delete user types like Test Managers and Test Engineers
- Create/Edit/Delete the Projects
- Create Additional Test Manager accounts
- Create/Edit/Delete Scripts and Scenarios
- Execute Scripts and Scenarios
Test Engineer:
- View Assigned Projects
- Create/Edit/Delete Scripts and Scenarios
- Execute Scripts and Scenarios
*Note: Only Super Admins can create organization accounts.
- Enter the old password, type the new password, then confirm the password.
Application Details and Test Credentials
| Credential | Values | Comments | |
| 1 | Development Url | http://dev-gtp.royalcyber.org/#/dashboard | If the URL is not accessible on a public network, try the following steps 1. Navigate to chrome://settings/security?search=DNS 2. Make sure the ‘Use Secure DNS’ option is Turned Off |
| 2 | QA URL (GCP) | https://qa-gtp.royalcyber.org/#/login | |
| 3 | Production Site (GCP) | https://app.gotestpro.com/#/login | |
| 4 | Development Users | ||
| 5 | Super Admin User | demosuperadmin@rc.com/admin | |
| 6 | Test Manager User | demotestmanager@rc.com/admin | |
| 7 | Test Engineer User | demotestengineer@rc.com/admin | |
| 8 | Super Admin Org Admin/Project Manager Test Engineer | rcybertester@gmail.com/admin123 rteafmanager@gmail.com/manager123 rteaftester@gmail.com/tester123 | |
| 9 | QA Users | ||
| 10 | Test Manager | testmanager@rc.com/manager | |
| 11 | Test Engineer | testengineer@rc.com/engineer | |
| 12 | Super Admin User | rcsuperadmin@rc.com/admin | |
GoTestPro – Walkthrough Session
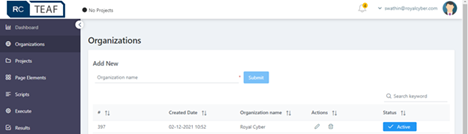
How to Create the Organization Account
- Log in as the Super Admin
- Click on Organizations from the Navigation Menu
- Enter Organization Name and click on Submit
- The Organization has been successfully created!
How to Register/Sign Up as a User (Test Manager by default)
How to Create User Roles
Org Admin/Test Manager
- Login in as Super Admin
- Click on Users from the Navigation Menus
- Enter Email Address, First Name, Last Name
- Select User Role
- Select Organization and click on Create User
- The users have been successfully created.
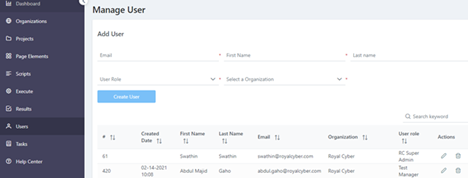
Test Engineer User Creation
- Login with Test Manager Credentials
- Click on Users from the Navigation Menu
- Enter Email Address, First Name, Last Name
- Select User Role
- By default, the Organization has been selected
- Select Projects from the Select Projects drop-down list.
- The users have been successfully created/added.
Forgot Password
- Click on Forgot Password
- Enter the registered email address
- A link will be sent to the registered email address
- Click on the link
- Enter the new password & re-enter to confirm the password
- Click on the Confirm button
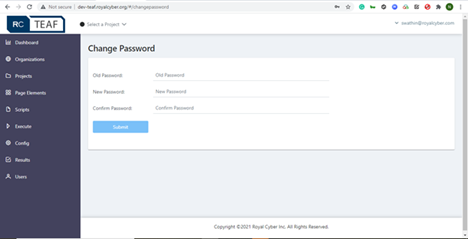
How to Change Password
- Login as an End User
- Click on the drop-down arrow
- Click on Change Password
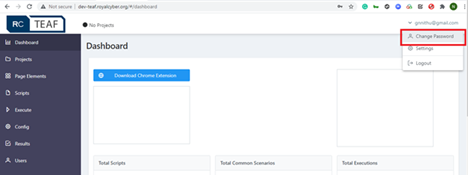
- Enter the old password, type the new password, then confirm the password.
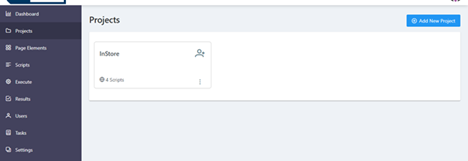
How to Create a Project
- Login as Org Admin/Test Manager
- Click on Projects from the Navigation menu
- Click on Add New Project button
- Enter Project Title, Project Type
- Select ‘Add Environment,’ enter Environment Name and Base URL (Application Test End Points), and then click on ‘Save.’
- Again, click on Save– the project has now been successfully created.
Note: In Add Environments, users can add up to 5 Environments, i.e. ( DEV, QA, UAT, Stage, PROD)
How to Assign Projects to Users /Add Users to Project
- Login with Org Admin/Test Manager credentials
- Click on Projects from the Navigation menu
- Created Projects are displayed on the Project Listing page
- Click on Add User icon from any account of the project
- On the Users page >> select the Filter icon of the email column, search for the user(s) that needs to be added
- Click the Edit Icon >> then select the required project from the projects drop-down list >> and select Click Update
- Users will be added to the project. Log in with the select user account allows access to project (s) and related scripts.
How to add TEAF Recorder Extension in Chrome Browser (QA/Dev Environment)
- Clone the TEAF_Recorder Extension files from Bitbucket QA Branch https://bitbucket.org/royalcyberxdev/teaf_recorder_plugin/src/qa/ or ../dev to any local folder. (for access, please reach out to our expert ). Make sure you cloned from the QA Branch, or you can download the repository using Bitbucket >> then select ‘More Options Download’ after changing the branch to Dev/QA.
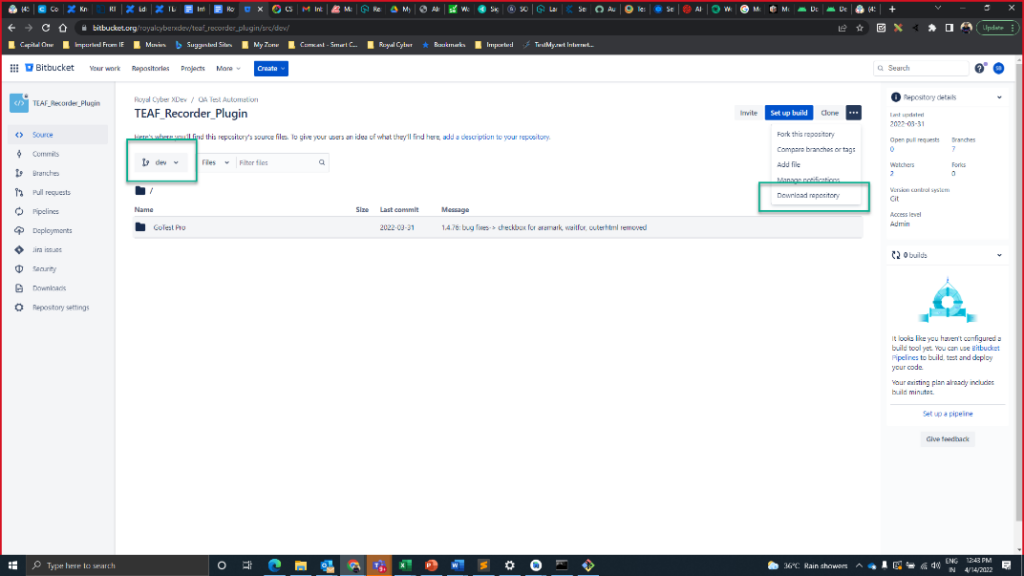
- Open chrome://extensions/ on your chrome browser
- Enable Developer Mode
- Click on Load Unpacked and select the ‘GoTestPro‘ from the cloned folder path.
- TEAF Recorder Extension will be added to Browser (Screen 1)
- To make the Extension access the browser in Incognito mode, click Details >>Turn on Allow in incognito (this need to be done only for the first time when reinstalling the extension – reloading/updates should work fine next time)
- To add your browser – click the Extensions icon from the browser and click the Pin icon
- To make sure you have the latest version of the extension available, please check with GTP QA Team
Screen 1 – Chrome Manage Extensions Page
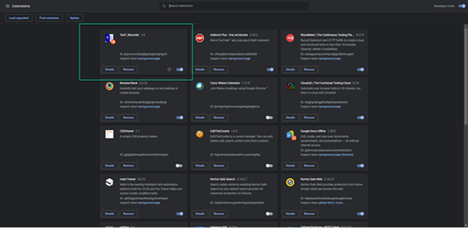
How to add a Published Extension from Chrome Web Store
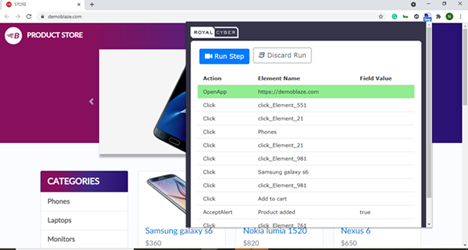
How to Create Test using TEAF Recorder Extension
- Log in as the Test Engineer
- Select the Projects from the ‘Select a Project’ drop-down list.
- Click on ‘Tests’ from the Navigation Menu
- Create the Test Name and Tag (the above steps are to be followed)
– Tags are used to group the tests, e.g., Sanity, Smoke, Regression, etc.
– Tags are mandatory to have to perform the execution on the Cloud/Server side
– We can execute scripts/tags without the Tag in Local Run if needed - Click on the Test View icon from the Tests Table.
- Click on the REC button on the Test Worksheet page
- Ensure you are updated with the latest Chrome Extension by navigating to Project Setting–>Chrome Extension setup. (This step is required only in a QA/Dev environment until the TEAF Recorder Extension is published on the chrome store – steps to get the extension id are given below)
- If the user has multiple environments, navigate to the Projects page, and click on the ‘True Under Default’ column to select a default environment.
- This step launches a new browser and a GTP Recorder extension. The browser should be loaded with an app URL added in the project>> Environment Base URL stage.
- Once the Application is launched on the web app, start recording.
- Now perform the needed actions in the Application.
- Click the ‘Stop Recording,’ scroll down, select ‘Application Name,’ then select ‘Script Name.’
Note: In QA/Dev Environment, we need to add the TEAF Recorder Extension to our Chrome Browser. The steps to follow are given below:
How to Execute Test at Client Level Run All Mode
Note: Test Configuration not required for Local Browser execution using GTP Recorder Extension
- Login as Test Engineer.
- Select the required project from the drop-down list.
- Navigate to the Test Worksheet page
- Click the Run
- Click on the ‘Local Execution’ option from the drop-down list.
- The Extension and Browser will be launched (on your local machine).
- Recorded Test will be executed.
- Execution Progress can be seen in the TEAF Extension
- Once execution is complete, click on Save Run from Extension, the test results will be pushed to the Results page, and the Application close. If the user wishes not to save the test run, Click on the ‘Discard Run’ button from the extension.
Note: Currently, we can perform Local execution only in Chrome Browser; hence we have an extension developed for chrome only.
Note: Currently, we can perform Local execution only in Chrome Browser; hence we have an extension developed for chrome only.
How to Execute Tests at Client Level Debug Mode
- To execute the Test step-by-step, we need to click the ‘Run’ button in the Scenario (only Common Scenarios and independent Scenarios will have Run buttons) page.
- Select ‘Debug’ mode from the drop-down.
- Test Application will be launched and paused
- Click the Run step, executing each step like a Debug Mode.
How to Create Data-Driven Scenario
- Login as Org Admin/Test Manager
- Select Project & Navigate to the Test Page
- Click on the Add New Test button on the Test Page.
- Enter Test Name & Tag Name
- Now Create a Test manually or through recording
- Execute the created Test to check the Result
- To add data-driven to the Test, capture the data in an Excel sheet which will be parameterized.
- Click on the Data-Driven table icon. The ‘File Upload Pop-Up’ form will open.
- Click the ‘+Choose‘ button >>then Browse for an excel/.xls File >> Click ‘Open’ in File Dialog >> Click the Upload button (Make sure we clicked the Upload button to upload the data)
- After uploading, we can select the column as Value or Element & click “Submit.”
- Now Parameterize the values & elements accordingly.
- Click on the ‘Edit’ step icon of the step.
- Click on Execute icon & you can see the no. of iterations captured and uploaded on the Excel sheet.
Scenario Duplication
Reuse the existing steps to the extent of functionality or navigational flow of a different alike scenario.
- Login as the Admin/Test Manager
- Select Project & Navigate to the Test Page
- In the Test Page, click on “Add New Test.“
- Enter Test Name & Tag Name
- Record Scenario manually or by selecting the Recording option.
- After execution, click the Duplication icon in Test Worksheet.
- A copy of the Scenario is displayed below the original one.
Record after Execution of Scenario / Execute and Continue Recording
Able to execute the Scenario once successful completion has the option to start recording and save it.
- Login as the Admin/Test Manager
- Select the Project & Navigate to the Test Page
- In the Test Page, click on “Add New Test.“
- Enter Test Name & Tag Name
- Create a Test manually or by recording
- Hover the “Play” icon from the Test accordion and click “Execute and Continue Recording” from the context menu.
- After execution of the Scenario, click the “Start Recording”
- Record Test from which the execution is started
- After recording, click the “Pause Recording” & save it as a new one or append it to an existing recording.
Execute And Continue Append to Existing.mp4Execute and Continue Save as new.mp4
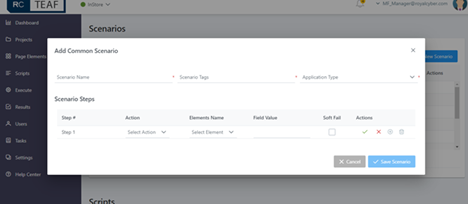
Common Scenario
- Login as Org Admin/ Test Manager
- Create the Test & Record Scenario manually or through the extension
- Click on the “Mark as Common Scenario” icon in the Script Worksheet
- Now, we can use the Common scenario/Reusable Scenario for another Script
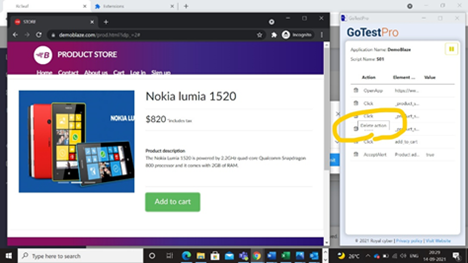
Delete while Recording
- Login as Admin/Manager
- Create the Test & start recording the Scenario
- While recording, you can Delete the steps which are not required by clicking on the “Delete” icon from the extension.
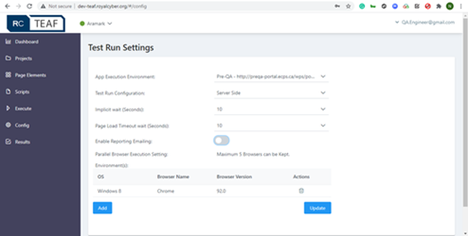
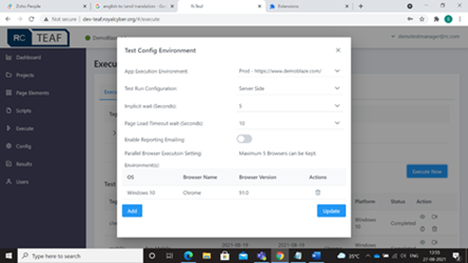
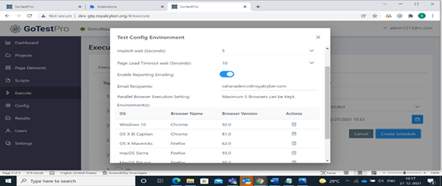
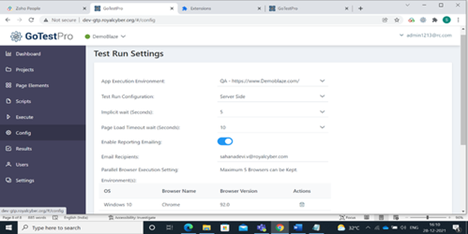
How to add Test Configuration
Note: Applicable for Server Side Execution – LambdaTest Platform
- Log in as the Org admin/Test Engineer
- Click on the Config option from the Navigation Menu
- Select the Execution Environment, Test Run Configuration, Implicit wait, & Page Load Timeout wait from respective drop-down options.
- Enable the Email Reporting toggle button for receiving reports via email
- Click on Add button to add environments like OS, Browser Name, Browser version
Execute Scripts on the Server side – LambdaTest
- Login as Org Admin/Test Engineer
- Select the required project from the drop-down
- Navigate to the Run menu
- Select Tag (Test) in the Run page to execute
- Click Execute Now button
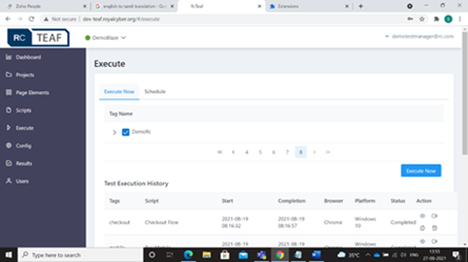
- Update the Test Configuration environment details & click Update – By default, the Project level Test Configurations will be loaded
- You can then view the execution status in Test Execution History
- Once the status changes to Completed, select the View Report (Eye) icon.
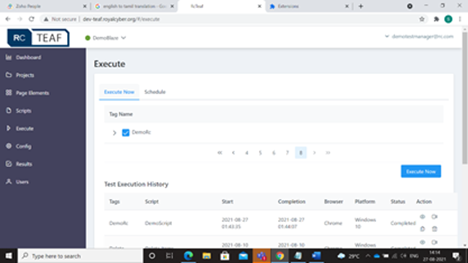
- The Result Detail page displays a Pass/Fail status
- We can also view the test execution in the Recorded Video option by clicking on the Video icon from Execute >> Execute History >> Play video and also view the PDF results by clicking on ‘View PDF’ from the Results page.
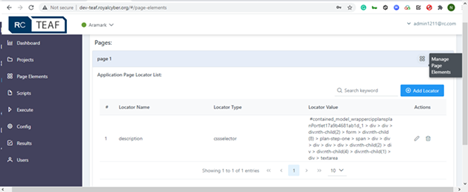
How to add Page Elements (Locators)
Note: Not mandatory to create; hence the Recorder can be used to create Scenarios and Page Elements
- Login as Org Admin/Test Engineer
- Select Page Elements from the Navigation Menu
- Enter Page Name (AUT pages – Application Under Test). Ex: Login Page, Home Page, Cart page, Product Details page, etc.,
- To Delete the Page Name, click on the Delete icon.
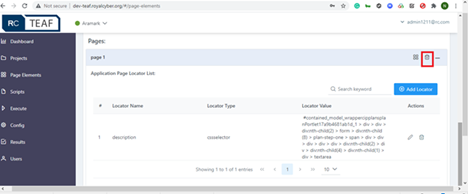
- Click on the Four Dots icon to add locators to the page
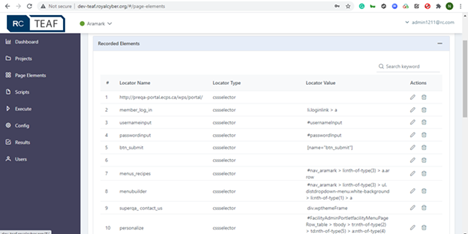
The Recorded Elements Section contains locators for recorded pages
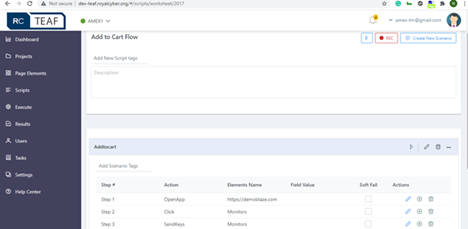
How to Create Scenario (Manually)
Note: Using this feature to perform manual creation for a BDD Script Creation experience- we recommend the GTP Recorder Extension to create the Scenarios and Page Elements
- Login as Org Admin/Test Engineer
- Select a Project from the Select a Project drop-down (at the top left corner) list.
- Click on the Test option from the Navigation menu.
- Click on Add New Scenario.
- Enter the Scenario Name and Scenario Tags, and select the Application type from a drop-down list.
- To add Scenario steps >> Click on the Edit icon from the Actions column >> Select the needed values like Action, Elements Name, and Field Value, then click on the ‘Yes’ icon, and the steps will be saved.
- Click the + icon to add more steps.
- Select the application type from the Application type and choose the Save Scenario
How to Create a Scheduled Test
Users can access the Scheduler page to schedule tags/test scripts at a specific time.
- Log in as the Manager/ Test Engineer.
- Create Test, Record & Save.
- Navigate to the Run Page.
- Click on the Schedule
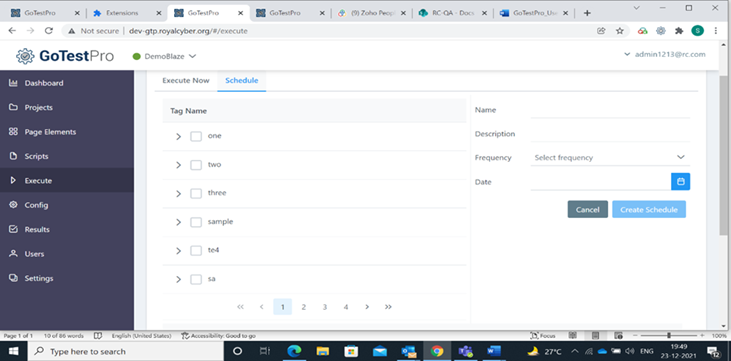
- Select a tag name & enter the values for the following mandatory fields: Name, Description, Frequency (Hourly, Weekly & Monthly), and Date.
- Click on the Create Schedule
- Select needed environments in the Test Configuration Environment window & click
- Users can schedule tests with the following possibilities:
- Can schedule single Tag with one test config environment (single browser)
- Can schedule individual scripts under various Tags with one test config environment (single browser)
- Can schedule multiple Tags with one test config environment (single browser)
- Can schedule multiple Tags with one test config environment (single browser)
- Can schedule individual scripts under various Tags with Multiple browsers and test configuration environments.
- Can schedule multiple Tags with Multiple browsers and Test config environments.
Now the scheduled Tag is displayed in the Scheduler Table list
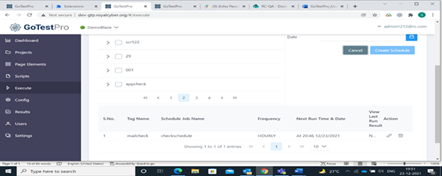
The scheduled tags/ scripts will be executed at the arranged time.
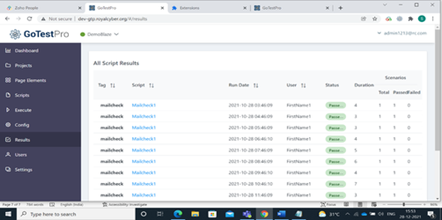
Results Page
- Login as Test Manager/Test Engineer.
- Select the required project from the drop-down options.
- Navigate to the Test page >> Record Scenario >> click Save.
- Then, navigate to the Run
- Select Tag (Script) in the Execute page for execution.
- Click Execute Now
- Update the Test Configuration Environment details >> click Update and navigate to the Results
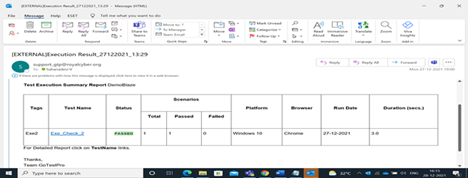
- The user can view the Overall Results table with Script& Tag name, Run Date, Username, Execution Results Status, Scenario Status, Execution Total time, Platform, Browser name, Scheduled/ Manual indicator, and can view the Detailed Report link too.
- The user can view the Overall Results table with Script& Tag name, Run Date, Username, Execution Results Status, Scenario Status, Execution Total time, Platform, Browser name, Scheduled/ Manual indicator, and can view the Detailed Report link too.
Reports Emailing Enablement
- Login as Test Manager/Test Engineer.
- Select the required project from the drop-down list.
- Navigate to the Test page >> Record Test >> Save Test.
- Navigate to the Run
- Select Tag (Script) in the Execute page for execution.
- Click the Execute Now
- Update the Test Configuration Environment details.
- Switch on the Enable Report Emailing toggle button & enter the email id to get the detailed results.
- Click the Update
- After the test execution, the email recipient will get the reports directly from GoTestPro.11. By clicking on the Test name, the recipient can navigate to the Detailed Result Page of GoTestPro.
- By clicking on the Test name, the recipient can navigate to the Detailed Result Page of GoTestPro
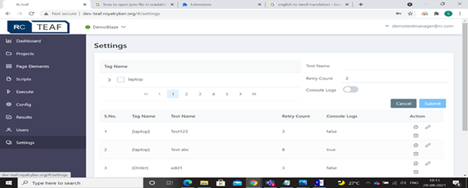
CI/CD ( Test trigger API)
GoTestPro has a “Settings” page where the user can generate the ClientID & Secret/API String, whichever is more straightforward and more secure to implement.
(Set up a continuous Test Job in Jenkins/other DevOps servers)
- Login as Manager/ Test Engineer.
- Create Script, Record & Save.
- Navigate to the Run Page & click on CI/CD
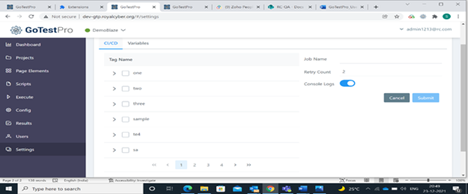
- Select the Tag and create a Job Name through the input fields given.
- Enter the Retry Count that specifies the number of times to re-run a job in case of failure.
- Enable/Disable the Console log toggle button & click Submit.
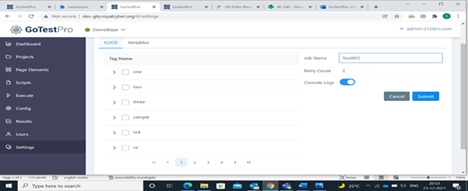
- Select the needed environments in the Test Configuration Environment window & click Submit.
- Now, the user can copy a rest endpoint/URL with an authorization key & JobId by clicking on the copy URL icon, which can be used in the HTTP Request Plugin in Jenkins/other DevOps servers.
Auto Healing Feature
On the GoTestPro extension, users can find the element on the application page by using the different locators (like id, XPath, cssselector, name, classname) which have been picked up during the recording of the Scenario. During execution, if an element is not recognized by one locator value, the auto-healing mechanism will look for other locators till it finds the element and proceed with the execution. Thus, the user can execute the script without bothering the elements recognized by the automation tool and can execute the scripts in unattended mode.
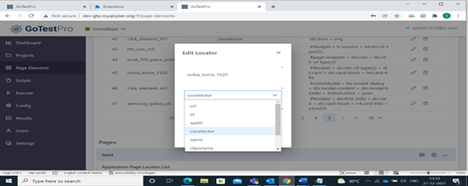
Sample image to notify element locator types being recorded by GTP recorder extension
How to add Assertions & Events while Recording
- Login as Manager/ Engineer
- Navigate to Tests >> Click on the “Create New Test”
- Create a Test with the Test name & Tag name.
- Click on the Recorder icon on the Test Worksheet page.
- The web app alongside the GTP Recorder extension will open.
- The browser should be pre-loaded with the app URL added in project>> Environment Base URL.
- Now the user can perform the Application’s actions and add Master Actions.
- Right-click on the Application and select GTP.
- Now add assertions/events from the GTP Context menu while recording.
- After adding assertions from the Context menu, the actions are added in the plugin steps.
- Click the ‘Stop Recording‘ button, scroll down to the Select Application Name, then select Script Name.
- Click on Execute icon on the Script Work Sheet page & verify the actions with added assertions.
GTP has the following Assertions:
Add Mouse Hover Action:
In some cases, we may want to mouse hover on an element and check if the button state/color changes after mouse hover.
Assert Element:
It checks whether that element is present on the page or not
Add Wait Time:
Some cases need a hard waiting time.
Add Check Assertion:
Verifies whether the check box is checked or not during test execution.
Add Uncheck Assertion:
Verifies whether the check box is checked or not during test execution.
Add Enabled Assertion:
Checks whether Button/Text Box is enabled or not during test execution.
Add Disabled Assertion:
Checks whether Button/Text Box is disabled or not during test execution.
Add Page Title Assertion:
There are cases where we need to check the title of a particular page
Add Tool Tip Message Verification:
Some cases need verification of the tooltip message during test execution.
How to add Variables:
- Login as Manager/Engineer
- Variables are categorized as Local and or Global
How to save Global variables:
Can use the Global variables across the project
- Navigate to the Settings page from the side menu
- Clicks on the Variables tab & enter the variable name & value
- Clicks on the Save button
How to save Local Variables:
The Local variable is scoped within the Scenario and should be defined while recording the script
- After saving the Global variables, click on Tests from the side menu
- Clicks on Add New Test (Browser Test) & enter the Test name & Tag name
- Users can add local variables while recording or by managing the variables tab
- Users can choose the defined variables by right-clicking and selecting from the GTP Context menu.
- Users can capture the value and can add variables against that value at the “step in recorder” extension while recording.
- The users can use the defined variables among steps in the web app.
How to Export Test Execution Results to Xray – Jira
Users should be able to send the automated test scripts execution results to Xray for the test cases created in Xray – Jira for the Application under Test.
- Login as a Manager/Engineer.
- Navigate to the Settings page from the main menu.
- Click on the Xray Integration
- Enter the needed inputs for the following fields: Jira URL, Jira Username, Jira API Token, Xray Client ID, and Xray Client Secret.
- Click on the Connect
- Next, the user has to select the Jira project & GTP Project for project mapping.
- Navigate to the Tests page & create a New Test.
- Record a scenario & map the ‘Jira key’ against the script created for that test case.
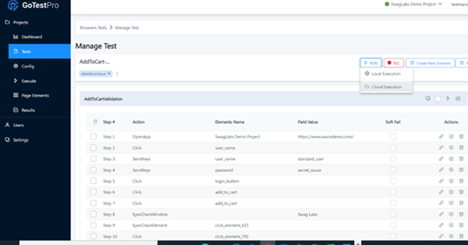
- Execute the Test by clicking on Cloud execution from Execute Context menu
- Once execution is completed, click the View Results link in the Manage Test Page tab.
- Click the Export to Xray icon in the Results Detail Page, and the user(s) now get an execution Jira key id.
- When clicking on Jira key link, the user can see the Test execution page on the Jira app.
API Testing
In GTP, the user(s) can implement API testing without interacting with the UI/AUT.
- Login as Test Manager/ Engineer
- Create a project for API testing & select the project type as an API test.
- Clicks on Tests from Side Menu
- Clicks on the API Tests tab & click the Add New Test
- Enter the Test name and the description & click the Create Test
- In the Manage test page, click the ‘Create API Test’ button & start creating the API Test.
- Enter the Scenario name, Select the request method (GET, POST, PUT, PATCH, DELETE) from the drop-down and enter desired endpoint URL against which the request is to be triggered. In addition, values for the Headers & Body fields need to be entered.
- After entering all inputs, click on Send Request
- Now the user(s) can get a response for their API requests.
- Click on the Save button and view the created API tests on the Manage Test page.
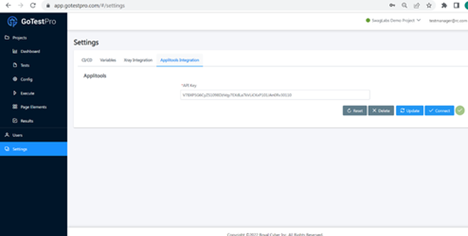
How to do Visual Validation:
- Login as Test Manager/ Test Engineer.
- Create a Project and Navigate to the Settings Page
- Clicks on the Settings page and select the Applitools Integration tab
- Enter the API key in the text field.
- Navigate to the Tests Page and Create New Test
- While recording the scenario -> Right Click-> Select GTP Context Menu-> Select Visual Testing -> Select Visual Assertions
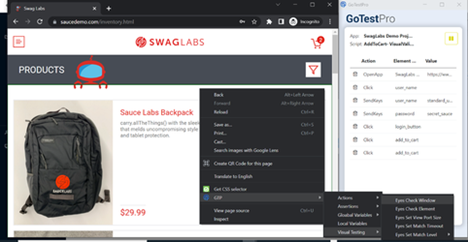
Eyes Check Window – Captures all the content in the browser or application window.
Eyes Check Element – Captures the image in a rectangular area defined by the element, which is provided as a parameter.
Eyes Set View Port Size – a visible area of an application within the application window. The viewport size can impact the layout of a page.
Eyes Set Match Timeout – Sets the timeout using the eyes set match timeout. This command takes as a parameter the timeout time in milliseconds.
Eyes Set Match Level –
Exact – pixel-to-pixel comparison
Strict – Strict compares everything, including content (text), fonts, layout, colors, and position of each of the elements
Content – Content works similarly to Strict except for the fact that it ignores colors
Layout – Layout, as its name implies, compares the layouts (i.e., structure) of the baseline and actual images
- After adding the Visual Assertions, save the Scenario, and Execute it on Cloud Level
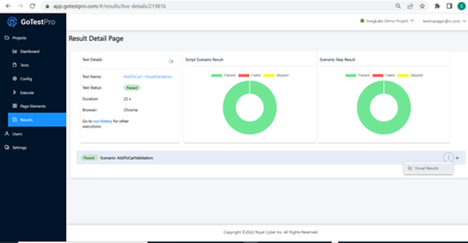
Once the Execution is completed, click on the Visual Results from the Context Menu on the Result Detail Page
It navigates to the Applitools page, and users can see the Visual images. First, executed results are considered as a baseline image.
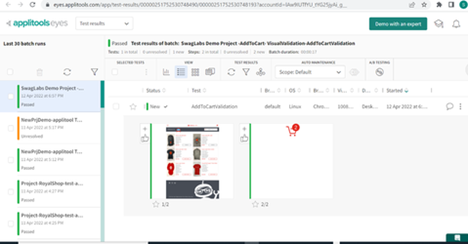
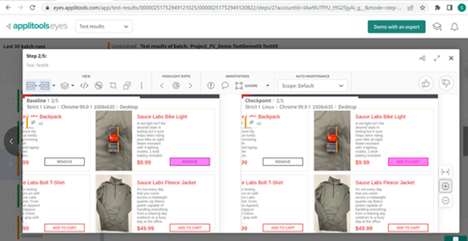
Execute the same Test again at the Cloud level; that result image will compare with the baseline image.
If any Mismatch is found, it highlights the Visual changes with a pink highlight.